Quick Answer
To track machine availability, mining and field service contractors should:
- Use the formula (Scheduled Time − Downtime) ÷ Scheduled Time × 100
- Target 85–90% physical availability for heavy mobile equipment
- Capture downtime at source on phones or tablets, not from memory
- Report both physical and mechanical availability
- Pair with MTBF, MTTR and a Pareto of downtime causes
- Root-cause every unplanned event over 8 hours and feed it back into the schedule
What is machine availability?
Machine availability is the percentage of scheduled time an asset is capable of running when it's needed. It's the single most important reliability KPI in mining and heavy equipment maintenance — every contract schedule, every monthly board report and every workshop KPI board ends up pointing back to it.
It answers one question: when we needed this machine, could we use it? Utilisation, production and cost-per-hour all live downstream of availability. If availability is broken, nothing else works.
The formula
Availability % = (Scheduled Time − Downtime) ÷ Scheduled Time × 100
Scheduled time
The hours the asset was planned to be available for work in the period (e.g. 24 × 30 = 720 hrs for a 24/7 haul truck across a month).
Downtime
Every hour the asset was not available during scheduled time — planned services, breakdowns, waiting on parts, waiting on labour.
Availability %
(Scheduled − Downtime) ÷ Scheduled × 100. Report monthly against the fleet benchmark, and track the trend, not just the point-in-time number.
Worked example: one haul truck, one month
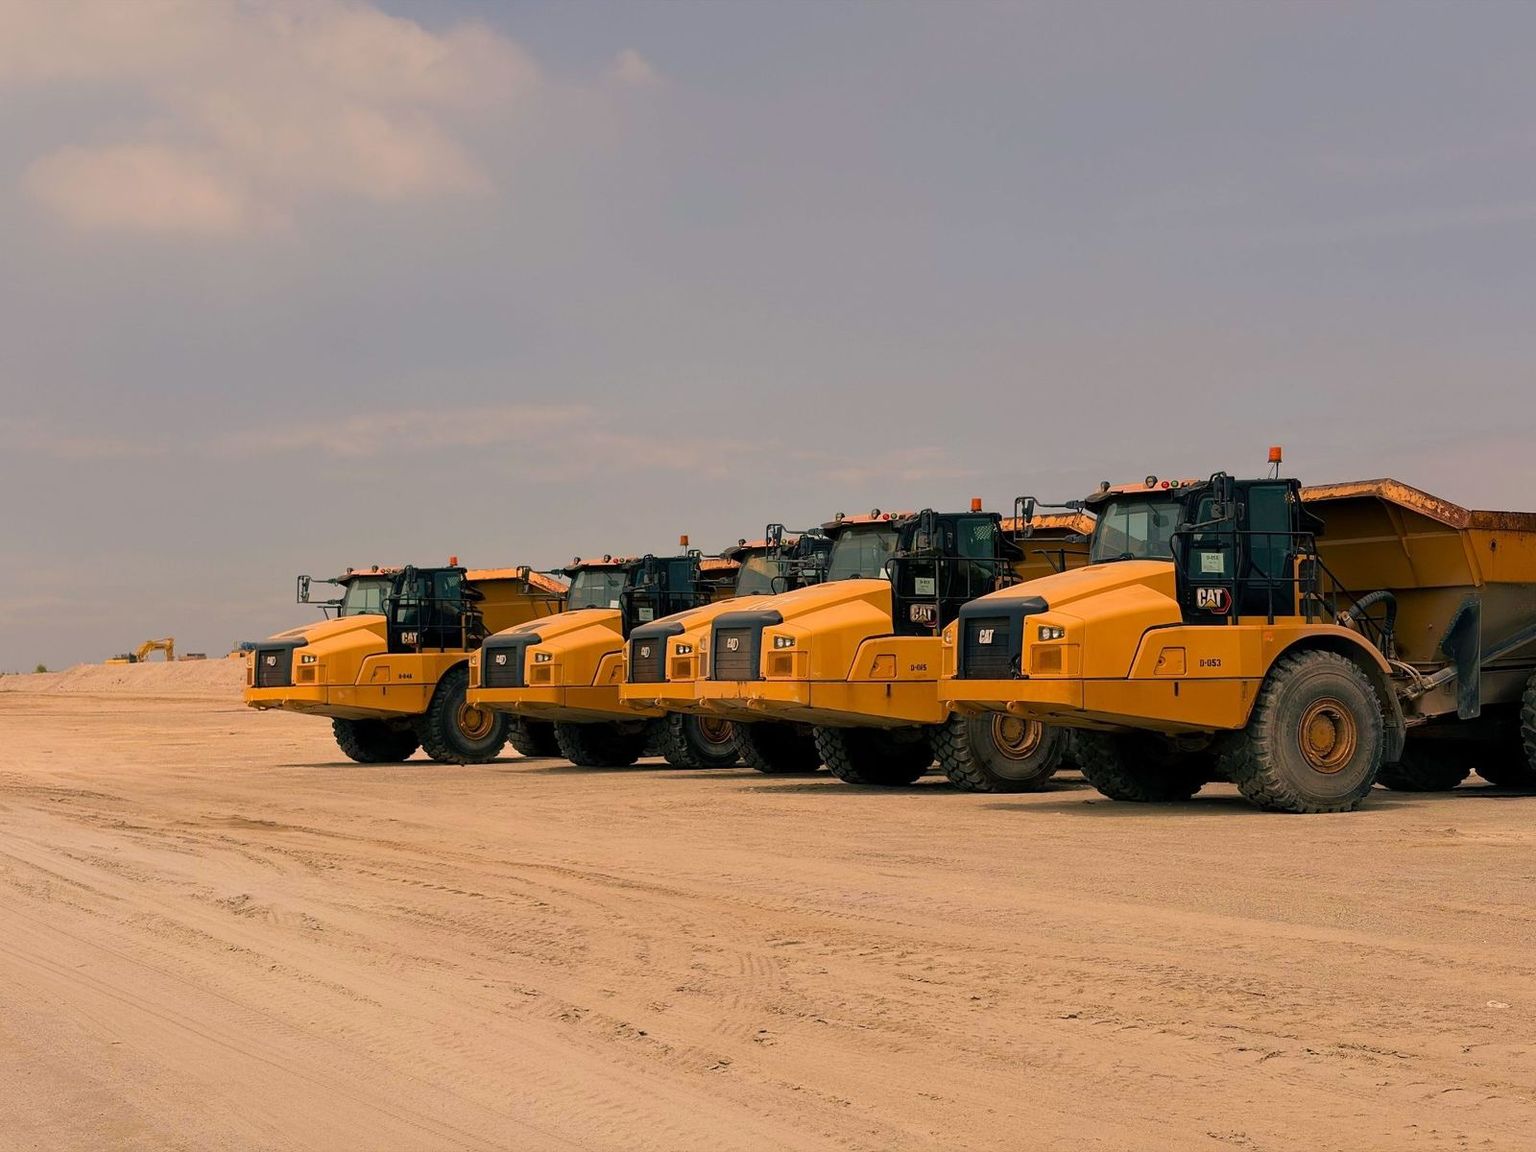
A 100t rigid haul truck rostered 24/7 across a 30-day month:
| Scheduled time | 720 hrs |
| Planned maintenance | 42 hrs |
| Unplanned breakdowns | 36 hrs |
| Waiting on parts | 12 hrs |
| Total downtime | 90 hrs |
Physical Availability
87.5%
(720 − 90) ÷ 720 — includes planned + unplanned
Mechanical Availability
93.3%
(720 − 48) ÷ 720 — excludes planned maintenance
Industry benchmarks by asset class
| Asset class | Physical availability | Mechanical availability |
|---|---|---|
| Haul trucks (rigid, > 100t) | 85–90% | 90–92% |
| Hydraulic excavators (200t+) | 85–88% | 89–92% |
| Dozers | 82–88% | 88–91% |
| Graders | 85–90% | 90–93% |
| Light vehicles / utes | 90–95% | 94–97% |
| Workshop lifting equipment | 92–96% | 95–98% |
Ranges are indicative of well-run Australian mining and civil operations. Contract schedules will often specify a hard target — 88% physical availability is a common benchmark for Tier-1 haulage contracts.
Physical vs mechanical availability
Physical availability
- Includes ALL downtime — planned + unplanned
- Reflects real-world availability to operations
- Used in most contract schedules
- Best single indicator of overall program health
Mechanical availability
- Excludes planned maintenance windows
- Isolates the reliability of the asset itself
- Used to judge OEM and rebuild performance
- Should always trend higher than physical
A 6-step framework to track availability
- 1
Register every asset
Build an asset register with plant number, make, model, SMU (service meter units) and its scheduled operating hours per week. You can't measure availability on assets you don't track.
- 2
Define downtime categories
Agree a short, mutually exclusive list: Planned Maintenance, Unplanned Breakdown, Waiting on Parts, Waiting on Labour, Waiting on Operator, Damage. Same list across every asset.
- 3
Capture downtime at source
The operator or tech logs downtime on a phone or tablet when it happens — start time, category, description. Trying to reconstruct it from timesheets on Monday always understates the number.
- 4
Reconcile weekly
A supervisor reviews the downtime log against shift handovers and dispatch data once a week. Missed events get added, misclassifications fixed. This is what makes the KPI trustworthy.
- 5
Report by asset and by fleet
Monthly report: availability % per asset, fleet rollup, top 5 downtime causes, MTBF and MTTR. Send it to the client if you're a contractor — transparency beats surprise.
- 6
Close the loop
Every unplanned event over a threshold (e.g. 8 hrs) gets a root-cause review. The output feeds the planned maintenance schedule so the same failure doesn't repeat.
KPIs to track alongside availability
| KPI | Target | Why it matters |
|---|---|---|
| Physical availability (PA) | ≥ 85% (heavy mobile) | Master reliability metric across all downtime causes |
| Mechanical availability (MA) | ≥ 90% (heavy mobile) | Isolates breakdowns from planned work |
| MTBF (Mean Time Between Failures) | Trending up | Longer runs between unplanned stops = healthier asset |
| MTTR (Mean Time To Repair) | Trending down | Faster response and parts on the shelf |
| Schedule compliance | > 90% | Planned services actually happen on the due date |
| Downtime by category (Pareto) | Top 3 shrinking | Shows where to invest engineering effort next |
Common mistakes that break the number
If your availability number looks too good, one of these is usually why
- Downtime is reconstructed from memory at end of month — short events go missing
- 'Standby' or 'no operator' events are excluded even when caused by a defect
- Planned services are logged against the wrong asset or day
- Different assets use different downtime categories — the rollup is meaningless
- Scheduled time is calculated wrong (e.g. counting rostered-down days as scheduled)
- Nobody reconciles the log against dispatch or shift handover data
How SprintSuite tracks availability
SprintSuite ties assets, prestarts, work orders and downtime capture into one flow — so availability is calculated from live field data, not a spreadsheet reconstructed at month-end.
Asset management
Every asset, plant number and SMU in one register with service intervals and downtime history.
Workshop management
Digital work orders with start/finish stamps that feed downtime directly into the availability KPI.
Reporting
Monthly availability, MTBF, MTTR and a Pareto of downtime causes — per asset and per fleet.
Frequently asked questions
Keep reading
Turn availability into a live number
Stop reconstructing downtime at month-end. SprintSuite captures it at source and reports availability by asset and by fleet — every day, not just on the last Friday of the month.
Explore Asset Management