Quick Answer
Western Australia is one of the world's largest mining jurisdictions. Based on WA Government resources industry data for calendar year 2025 (published 28 May 2026):
- $226 billion in mineral and petroleum sales in 2025
- Iron ore $126 billion, with a record 889 million dry metric tonnes exported
- Gold $36 billion — a record, and now WA's second most valuable commodity
- 136,000+ full-time equivalent on-site mining jobs, plus 11,244 in petroleum
- $10.6 billion in royalty and related revenue to the WA Government
- $2.7 billion record mineral exploration spend and $34 billion decade-high investment
How big is the mining industry in Western Australia?
By value, Western Australia is one of the largest mining jurisdictions on earth. In calendar 2025 the state recorded $226 billion in mineral and petroleum sales, supported more than 136,000 full-time equivalent on-site mining jobs (plus 11,244 direct petroleum jobs), and returned $10.6 billion in royalty and related revenue to the state. Those figures come from the WA Government's own resources industry data, published 28 May 2026.
What is WA mining worth each year?
The headline number to quote is $226 billion in sales for 2025. That is sales value of minerals and petroleum produced in WA, not profit and not gross state product. It moves with commodity prices as much as with volume — which is why gold's record $36 billion came on a production rebound rather than a production boom, and why lithium set a volume record in a soft price year.
Which commodity dominates?
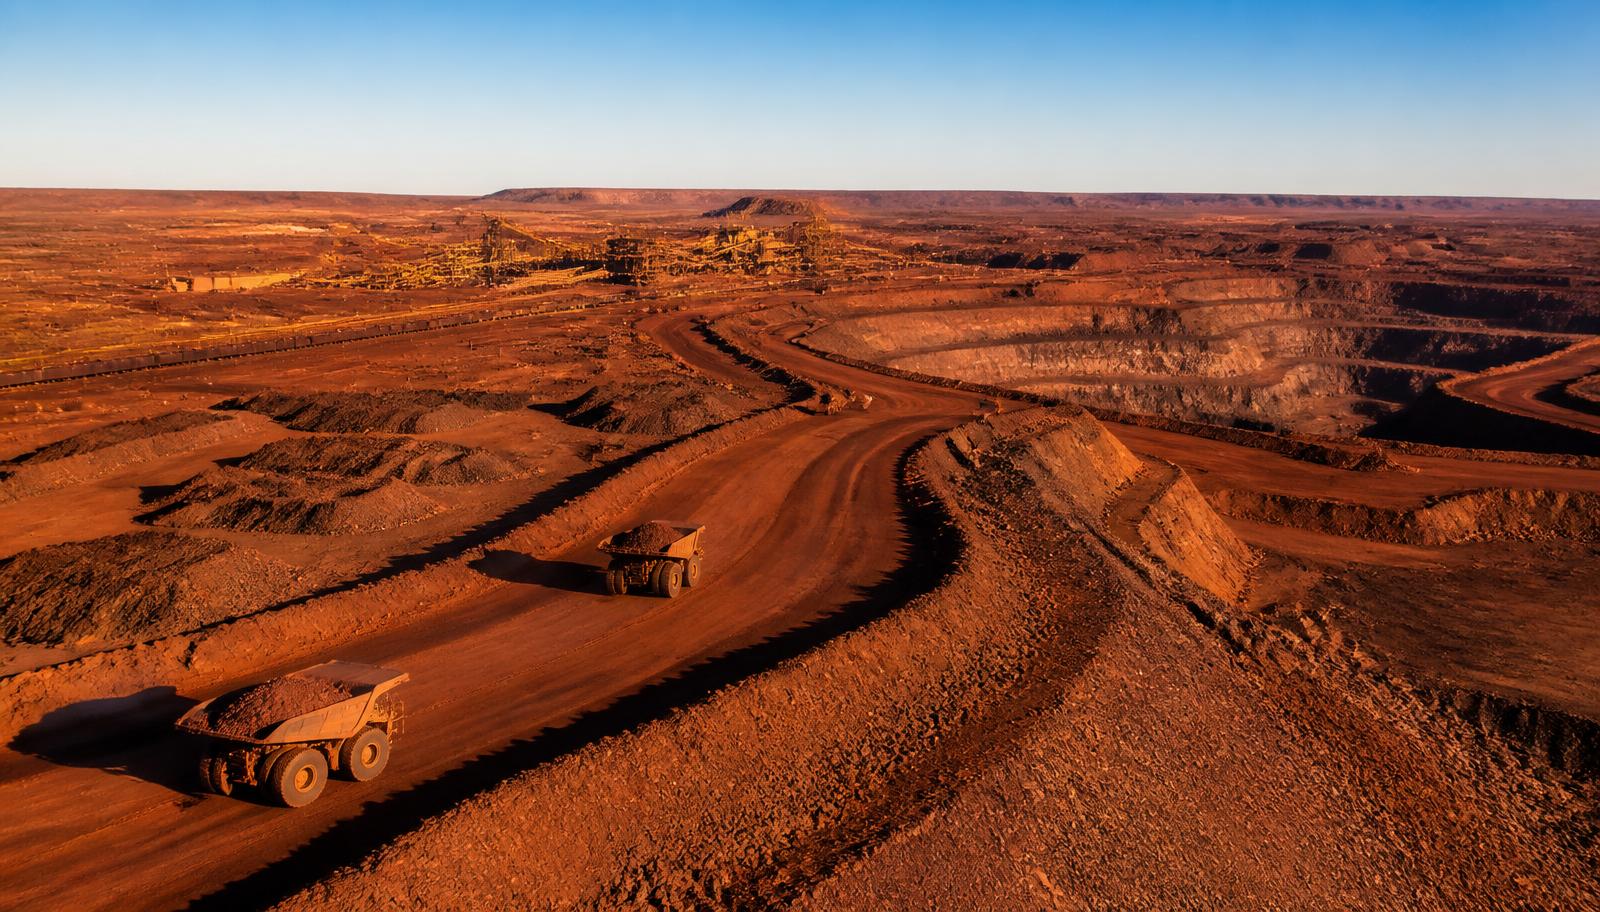
Iron ore, by a wide margin. At $126 billion it is roughly 56% of the state's total mineral and petroleum sales, and 2025 set an all-time export record of 889 million dry metric tonnes. Gold is a clear second at $36 billion, followed by LNG at $32 billion. Everything else — lithium, alumina and bauxite, nickel, copper, salt, mineral sands, rare earths — sits behind that top three.
How many people work in WA mining?
More than 136,000 full-time equivalent on-site mining roles in 2025, a record level, with a further 11,244 employed directly in petroleum. On-site FTE counts the people physically working at operations, which includes contractor crews — a large share of maintenance, shutdown, drilling, earthworks, electrical and workshop labour on WA sites is delivered by contracting businesses rather than the mine owner.
Is the industry still growing?
Investment says yes. Mining and petroleum investment reached a decade-high $34 billion and mineral exploration expenditure hit a record $2.7 billion in 2025, with gold and iron ore the main exploration targets. Exploration and capital spend are the leading indicators contractors care about: they precede new pits, camps, plant builds, sustaining capital works and the maintenance load that follows them.
How much of the WA Budget comes from mining?
Royalties are the direct line from mine gate to state finances. Resources royalty and related revenue reached $10.6 billion in 2025, and mineral royalties have been reported as contributing over 20% of the state's bottom line in recent WA Budget commentary. That is the reason mining approvals, workforce and safety regulation get the political attention they do in WA.
Where is the activity concentrated?
Four clusters carry most of the load. The Pilbara (Port Hedland, Karratha, Newman, Tom Price) for iron ore and offshore gas onshore processing; the Goldfields-Esperance region around Kalgoorlie for gold and nickel; the South West and Great Southern for alumina, bauxite, mineral sands and lithium; and Perth as the corporate, engineering, workshop and FIFO hub feeding all of them.
How does WA compare to the rest of Australia?
WA is the largest resources state by value, driven almost entirely by iron ore and LNG. Queensland's resources economy is weighted to metallurgical and thermal coal in the Bowen Basin, and NSW to Hunter Valley coal. If you contract nationally, this matters practically: WA work is dominated by iron ore, gold and gas clients with FIFO rosters and Pilbara logistics, while east coast work is coal-dominated with drive-in-drive-out and different award and inductions realities.
What the scale means if you're a contractor
A $226 billion sector run largely through contracted labour produces very specific commercial pressure. Tier-1 owners standardise onboarding, competency evidence, pre-starts, timesheet approval and invoicing across dozens of suppliers, and they audit it. The businesses that grow inside a market this big are usually not the cheapest ones — they are the ones that can produce records on request and invoice accurately against approved hours the first time.
WA's biggest commodities by sales value (2025)
| Commodity | 2025 sales | Detail |
|---|---|---|
| Iron ore | $126 billion | Record export volume of 889 million dry metric tonnes, mostly from the Pilbara |
| Gold | $36 billion | Record sales value; production rebounded to 6.8 million troy ounces (212 tonnes) |
| LNG | $32 billion | North West Shelf, Gorgon, Wheatstone and Pluto trains on the North West coast |
| Condensate | $6.7 billion | A by-product of WA's offshore gas production |
| Lithium (spodumene) | Record volume | Nearly four million tonnes of spodumene concentrate despite softer battery-mineral prices |
Source: Government of Western Australia resources industry data, media statement dated 28 May 2026. Figures are calendar year 2025 in Australian dollars and are revised periodically — confirm against the current Mineral and Petroleum Statistics Digest before citing them formally.
Win work in a $226 billion sector — and prove it on paper
SprintSuite connects quoting, scheduling, timesheets, competency records, pre-starts and invoicing in one system, so Pilbara and Goldfields crews capture evidence in the field and your office bills approved hours without rework.
Frequently asked questions
Related reading: Mining companies in Australia · Highest paying mining jobs · Mining electrician wages in Australia · Mine Electrical Safety Conference WA 2026 · Field service and workshop software in Perth